Bars & columns
Compare categories with grouped, stacked or 100% bars and columns.
Build charts and tables in your browser. Connect them to your flow, arrange them across pages and publish a dashboard for others to explore.
This example could not load. Reload the page to try again.
Open Vista and build your first chart. No sign-up, nothing to install.
Create calculated fields, parameters and filters from Vista. Their underlying logic lives in Strata, where you can inspect and change it.
This example could not load. Reload the page to try again.
Define a field once and use it across the visuals connected to that source. The formula remains available in Strata.
Let a dashboard input change a calculation or a supported flow setting.
Choose which source, page or visuals a filter affects. Its definition stays in the flow.
Choose the charts, tables, metrics, controls, text and custom plots your dashboard needs.
Compare categories with grouped, stacked or 100% bars and columns.
Follow changes over time with lines and areas, stacked or 100%.
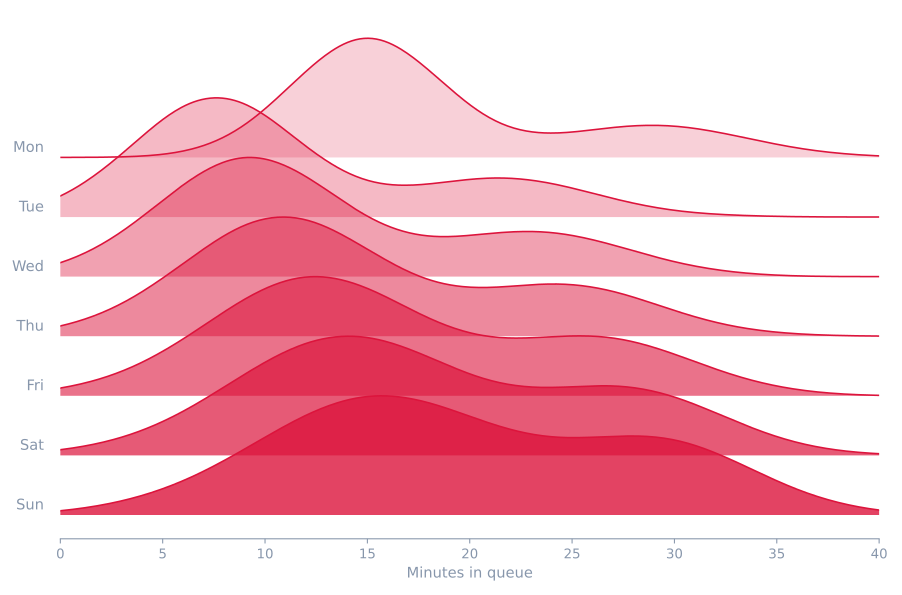
Inspect how values are spread across a dataset.
Explore relationships, clusters and density, with bubbles for a third measure.
Show proportions and nested categories with pies, treemaps, sunbursts and waffles.
Reveal patterns across categories, relationships and dates.
Compare several measures across groups.
Place events and durations along a shared timeline.
Keep an overview on one page, spread the detail across several pages or build a dashboard that grows as you add content.
Keep the important numbers together in a focused overview.
Separate topics and detail into pages within the same dashboard.
Keep adding content without setting a fixed page height.
Use Python or R when your dashboard needs a custom visual. Work with the source data and place the result alongside your other charts.
Build your plot with Matplotlib, using the columns from your source data. The result sits on the dashboard like any other chart.
Prefer R? Build your plot with base R graphics from the same source data and place it alongside your other visuals.
Build a visual, adjust the dashboard or investigate a finding. Elara can inspect results and edit the project you continue working in.
Why are returns so high? Break them down by reason. I'll split each category by return reason and check what stands out. Sizing causes 48% of returns, all of them in Footwear and Apparel.
This example could not load. Reload the page to try again.
Elara goes from a category total to the reason behind it, in the dashboard you keep working in.
Bring people into the project, or publish a saved version for everyone else.
Invite people to the project and choose whether they can edit or only view.
Give people a link to a dashboard that stays as it is while you keep working.
Schedule hosted runs to keep your dashboard up to date.
Build dashboards locally for free, and viewing is free too. Pay for hosted runs, Elara and connector transfers when you use them.
Work locally without an account. Sign up for free to get a one-time $10 of usage.
Billed monthly. Excludes tax.
$192 billed annually. Excludes tax. Usage resets every month.
Starter $20, Regular $60 or Scale $200 a month, each with monthly usage you can assign to your teams. You can also buy usage from $10 without a subscription.
There are no seat fees, and local work stays free. Larger machines and larger transfers are coming.
Open Vista and start building your dashboard.